Chapter 4: How to Perform Data Analysis in Physics Investigations
What is Physics data analysis?
Data analysis in Physics is a process of organising and analysing experimental data to validate a hypothesis or theory.
It is an important part of the scientific method and requires students to demonstrate high competencies in key scientific skills.
In this article, we’re going to discuss:
- The Scientific skills required for Physics Data Analysis Task
- What’s asked in a Physics data analysis task
- Part 1: Quantitative Data Analysis
- Part 2: Qualitative Data Analysis
- Common Year 12 Physics Data Analysis Tasks
- Data Analysis Question on Circular Motion (Module 5)
What are the scientific skills required for data analysis in Physics?
The essential scientific skills required for practical investigations are listed below.
- Identifying types of variables (independent, dependent, and control variables).
- Drawing and analysing appropriate graphs, including a line of best fit.

Each graph contains different types of errors. - Assessing validity, reliability and accuracy.
- Determining the source of experimental errors.
What’s asked in a Physics data analysis task?
In Physics data analysis task, you’ll be given a description of the experiment and the experimental data. Then you’ll be asked to perform quantitative and qualitative analysis.
| Analysis Type | Detail |
| Quantitative |
|
| Qualitative |
|
Part 1: Quantitative Data Analysis (Graphs and calculations)
In quantitative data analysis, you’ll be asked to analyse the results of an experiment and then calculate an unknown value.
The process for performing a quantitative data analysis is outlined below.
| Step | Explanation |
| 1. Tabulate the results. | The results should be tabulated with independent variable in the first column and the dependent variable in the second column. In some cases, the independent and dependent variables need to be manipulated in order to produce a straight line. |
| 2. Identify the variables in the experiment. | There are three different types of variables:
|
| 3. Plot the data and draw a line of best fit. | A graph is a visual representation of a relationship between two variables: the independent and the dependent variable. Graphs make it easy to identify trends in data that you have collected and can be analysed in order to perform a calculation. Drawing a graph and using the gradient of the line of best fit is a technique that reduces the effect of both systematic and random errors and makes the experiment both more accurate and more reliable. 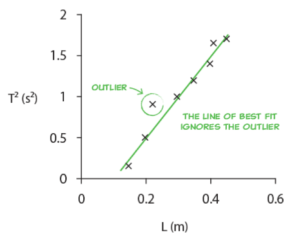
To learn how to draw a line of best fit. read the Matrix blog “Drawing graphs and lines of best fit“ |
| 4. Apply the mathematical model y=bx + c to determine the relationship between the dependent, independent and control variables. | If a line of best fit is drawn, then the relationship between the dependent, independent and control variables can be expressed as: Dependent (y) = Control (k) x Independent (x)
|
| 5. Express the gradient in terms of control variables. | If a line of best fit is drawn, then the gradient is equal to the control variables in the experiment. gradient = control variables |
| 6. Use the gradient and other given values to find the unknown in the control variable. | The unknown in the control variables can be calculated if the gradient and other values are known. The gradient can be found from the line of best fit using the formula \frac{Rise}{Run} . |
We’ll show you how to apply this process in a variety of examples later on.
Part 2: Qualitative Data Analysis (Evaluations of method and errors)
In qualitative data analysis, you’ll be asked to evaluate method and experimental errors.
Evaluation of experimental method
You must be able to discuss the variables in the experiment and assess the method and the result in terms of:
- Reliability: How close repeated measures are to each other
- Accuracy: How close the final result is to the correct or accepted value.
- Validity: The experimental method and how appropriate it is in addressing the aim of the experiment.
In the evaluation of method and errors part of the data analysis task, you’ll be also asked to make suggestions for improving the reliability, accuracy and validity of the experiment.
Refer to the table below for assessing the method and the result in terms of validity, reliability and accuracy.
| Assessment | Suggestion for improvement | |
| Validity | An experiment is valid if the methods are carried out appropriately and the control variables are kept constant. | Suggest experimental techniques that will ensure the experiment is valid. For example:
|
| Reliability | An experiment is reliable if you get very similar results for every experiment. | Suggest experimental techniques that will reduce random errors and improve the reliability of the experiment. For example:
|
| Accuracy | An experiment is very accurate if there is small difference between the experimental results and the accepted true value. | Suggest experimental techniques that will reduce systematic errors and improve the accuracy of the experiment. For example:
|
Evaluation of experimental errors
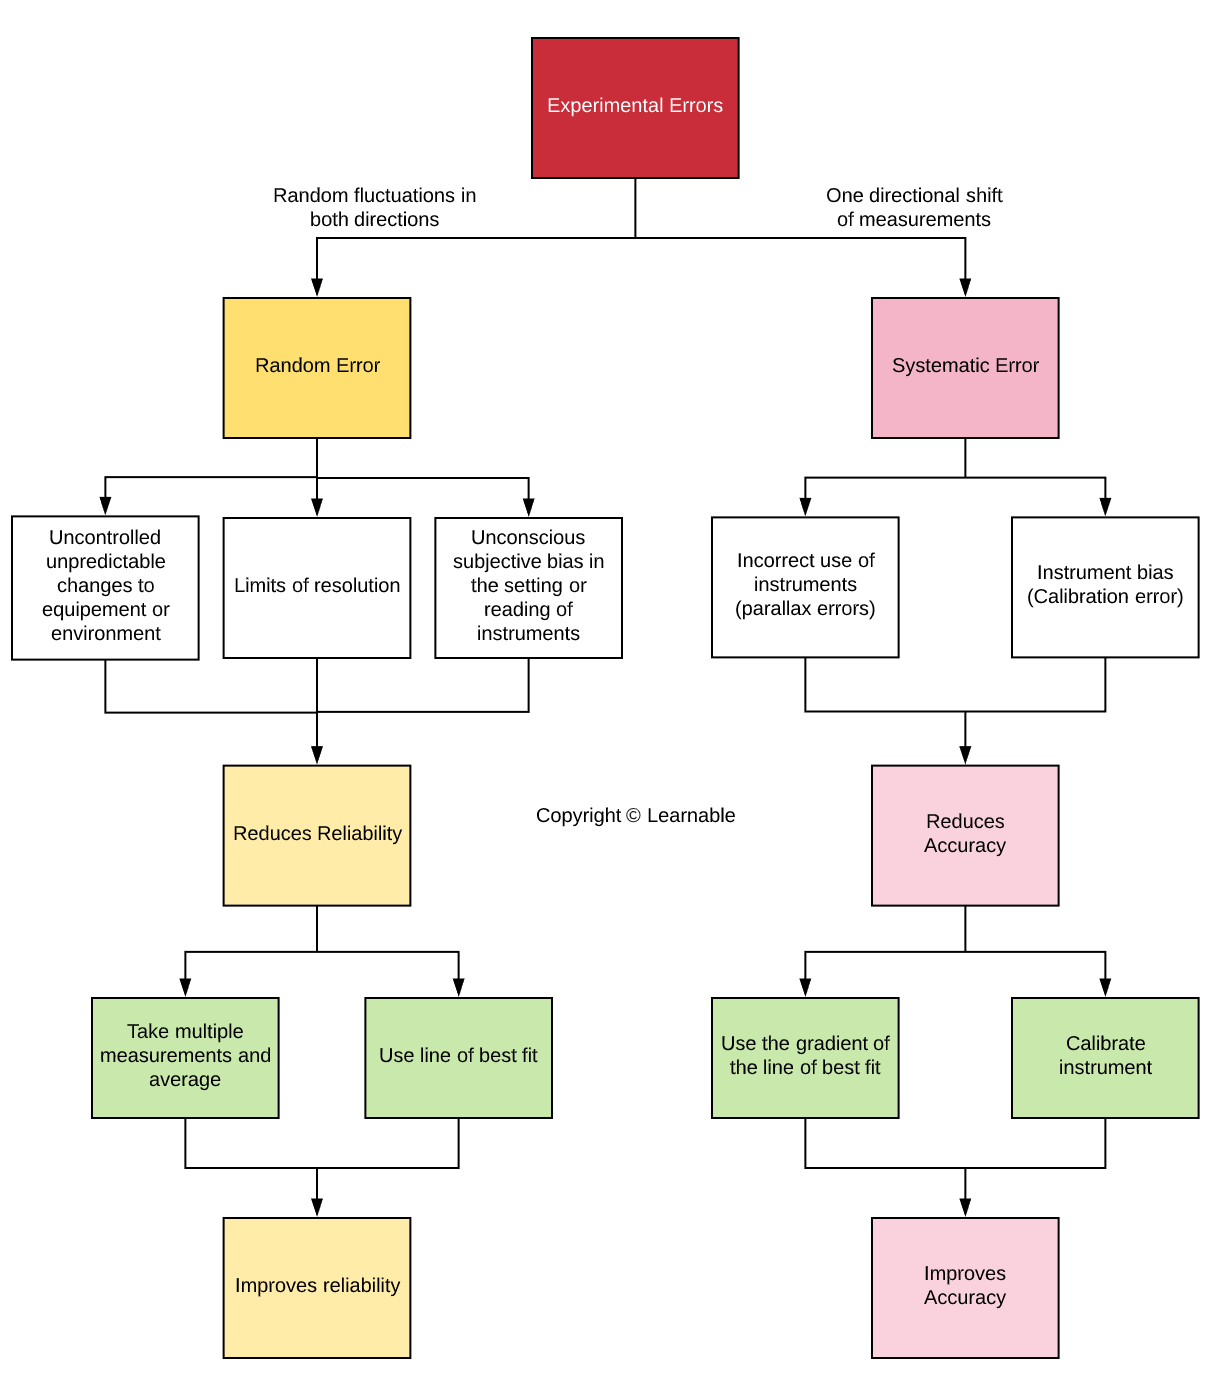
There are two types of experimental errors: random and systematic error. Experimental errors such as random and systematic errors are always present in an experiment.
In the qualitative part of a Physics data analysis task, you’ll be asked to
- Identify the type (random or systematic) and the source of error.
- Discuss the errors in the experiments and suggest ways of minimising them.
Random and systematics errors are related to reliability and accuracy respectively as illustrated in the flowchart below.
Common Year 12 Physics Data Analysis Tasks
A list of common data analysis tasks from Year 12 Physics course is tabulated below.
| Year 12 Physics Module | Topics and their Data Analysis Tasks |
| 5. Advanced Mechanics | Projectile Motion
Circular Motion
|
| 6. Electromagnetism | The motor effect
Electromagnetic Induction
Applications of the Motor Effect
|
| 7. The Nature of Light | Electromagnetic Spectrum
Light: Wave Model
|
Data Analysis Question on Circular Motion (Centripetal mass balance)
Aim
Hudson is performing an experiment to understand a centripetal mass balance. In particular, he wants to understand how the weight of the hanging mass (Mg) affects the rotational velocity (v) of the swinging mass.
Theory
The centripetal mass balance works by ‘balancing’ the weight force of a hanging mass ( W=Mg ) with the centripetal force of a swinging mass ( F_c=\frac{mv^2}{r} ). This experiment is based around the equation: Mg=\frac{mv^2}{r}
Method
Hudson has his centripetal mass balance setup as in the figure below:
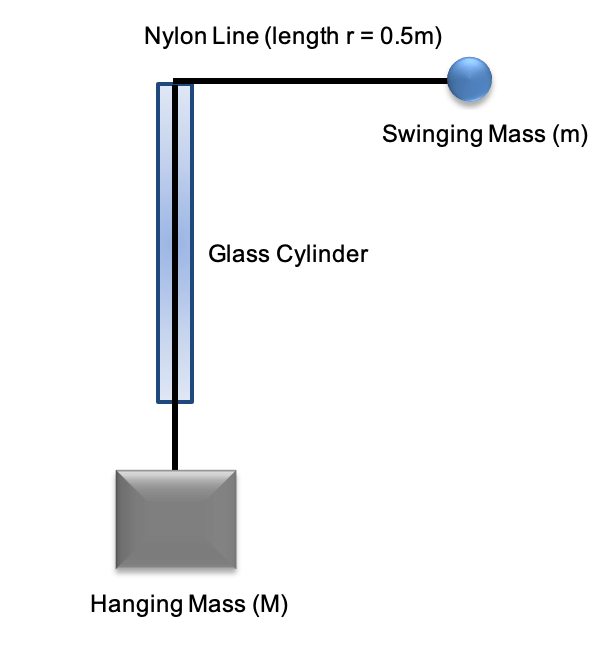
Hudson has used a clip to keep the length of the rope connected to the swinging mass (r) is constant throughout his experiment.
Hudson’s experimental method is as follows:
- Measure the hanging Mass (M) and rotating mass (m) using a scale.
- Measure the rotation arm (r) of the swinging mass using a ruler.
- Hold the class cylinder and spin the swinging mass, so that it makes a horizontal circle. Adjust the speed of swinging until the hanging mass is stable.
- Once the rotation is stable, record the time taken for 30 revolutions with a stopwatch.
- Repeat the experiment for different hanging masses (M).
Results
Hudson’s results are summarized in the table below. Compute the average period column below.
| Hanging Mass, M (kg) | Time for 30 Revolutions (seconds) | Average Period, T (seconds) | Velocity Squared, v2 (ms-2) |
| 0.1 | 30.35 | \frac{30.35}{30}=1.011 | 9.64 |
| 0.2 | 21.05 | \frac{21.05}{30}=0.701 | 20.04 |
| 0.3 | 17.48 | \frac{17.48}{30}=0.583 | 29.07 |
| 0.4 | 14.63 | \frac{14.63}{30}=0.489 | 41.50 |
| 0.5 | 13.42 | \frac{13.42}{30}=0.447 | 49.32 |
Quantitative Analysis
In order to plot this data, we must find a linear equation that relates our dependent and independent variables.
| # | Question | Marks |
| 1 | What are the independent and dependent variables in this experiment? | 1 |
| 2 | What is the relationship between period (T) and velocity (v) in uniform circular motion? | 1 |
| 3 | Hence show that v^2=(\frac{2\pi r}{T})^2. Use the above equation to fill in the final column of the table. | 2 |
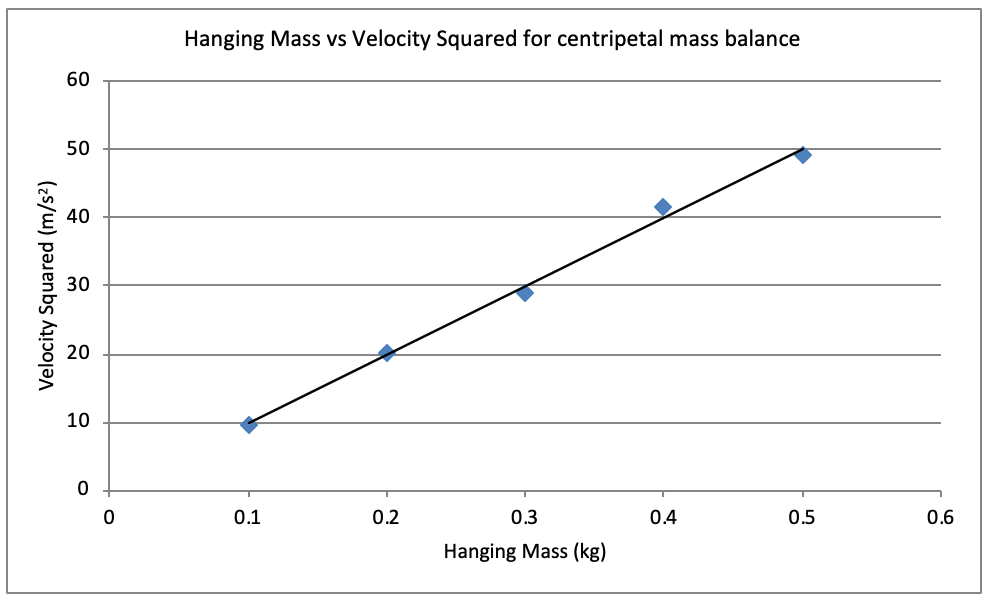
| 4. | Draw a plot of M vs \ v^2 . Calclate the gradient using a line of best fit. | 2 |
| 5. | Express the gradient in terms of control variables. Hence determine the value of the swinging mass, m. | 4 |
Qualitative Analysis
| # | Question | Marks |
| 6 | Outline one source of random error and suggest an improvement to the experiment that removes this source of error. | 3 |
| 7 | How would you assess the reliability of Hudson’s experimental results? Comment on the reliability of his results. | 3 |
| 8 | Hudson measured the mass of the swinging mass at the start of his experiment and found it to be 50 grams. Assess the accuracy of Hudson’s experiment. Outline any contributing factors that could have contributed to any inaccuracies. | 3 |
Answer
Quantitative Analysis
| # | Answer | Marks |
| 1 | Dependent Variable: Period. Independent: Hanging Mass | 1 |
| 2 | v=\frac{2\pi r}{T} | 1 |
| 3 | Refer to the table. | 2 |
| 4. |
| 2 |
| 5 | Step 1: We can find the meaning of the gradient of this graph by re-arranging our centripetal mass balance equation: Weight force = Centripetal force Mg = \frac{mv^2}{r} Step 2: Re-arrange the above equation into the form y = mx + b, where y is the dependent variable and x is the independent variable and m is the gradient of the line. Mg = \frac{mv^2}{r} \frac{Mgr}{m} = v^2 v^2= \frac{gr}{m} \times M Step 3: Express the gradient in terms of the control variables and the gradient. Gradient = \frac{gr}{m} Step 4: Using the gradient of your line-of-best fit from the data, and known experimental values (r, g), calculate the mass of the swinging mass (m). \therefore m=\frac{gr}{gradient} m=\frac{9.8 \times 0.5}{100} = 0.049 \ kg | 4 |
Quantitative Analysis
| # | Question | Marks |
| 6 | One source of random error is from inconsistent measurement of the period using a stop watch. Identifying the same start and finishing position of one rotation for the measurement of period is not possible. The use of multiple rotations (30 periods instead of one) and by using a line of best fit reduces the fluctuations in the measurements taken and hence minimises the random error. The same measurement (using the same procedure) should be repeated for each hanging mass M several more times. Statistically this would reduce the uncertainty in the average of all the periods for each hanging mass. | 3 |
| 7 | Reliability refers to how close the experimental results are to each other.
Since his data points don’t deviate much from the line of best fit, his results are reliable. | 3 |
| 8 | The accuracy of Hudson’s experiment is high since the difference between the actual value of the swinging mass (50g) and experimentally calculated value of the swinging mass (49g) is small (about 2%). The inaccuracies in his experiment may be due to
| 3 |
Access our library of Physics Data Analysis Questions
Get free access to syllabus specific Physics Data Analysis Questions written by expert HSC teachers. Join 10000+ students who are getting ahead with Learnable. Try for free now.

Written by DJ Kim
DJ is the founder of Learnable and has a passionate interest in education and technology. He is also the author of Physics resources on Learnable.
Learnable Education and www.learnable.education, 2019. Unauthorised use and/or duplications of this material without express and written permission from this site's author and/or owner is strictly prohibited. Excerpts and links may be used, provided that full and clear credit is given to Learnable Education and www.learnable.education with appropriate and specific direction to the original content.